At several times of the year, many institutions are in the process of building and finalizing term course schedules in time for registration. Leaders often rely on historical data to inform their course schedule planning, but with the anomalies of the pandemic, many are left wondering whether its data is useful to plan for future terms. While you might be tempted to completely throw out the data, we encourage you to consider to what extent pandemic-era data is an outlier through careful analysis. We’ve put together some key questions and data points with examples to help you with this process.
What policy changes occurred that may impact course enrollment or students’ “normal” registration patterns?
It’s important to understand how Covid-19 impacted enrollment cycles. For example, some institutions waived test score requirements that enabled students who may have previously been rejected to enter their institution. In other cases, institutions extended the drop/add period to allow students to drop without academic penalty much later in the term. Institutions also implemented additional guidelines for pass/fail options. These policy changes have implications for pandemic-centric terms that may carry over into future terms.
For example, what metrics should you review to understand how the Fall 2020 term unfolded?
Headed into Fall 2020, institutions were unsure of what to expect during registration. Many institutions believed that enrollment might be significantly down but then saw the enrollments rebound as the semester began. Other institutions saw the declining enrolment that others expected. To fully understand the Fall 2020 term, data should be reviewed.
Specifically, it’s helpful to understand these key metrics:
- Total number of sections offered
- Several patterns emerged in the data based on how institutions responded to the pandemic, like transitioning to online formats. Some institutions reduced the total number of sections offered by moving consolidated sections online instead of offering sections on multiple face–to–face campuses. Other institutions broke sections into A and B versions to allow for hybrid scheduling in face-to-face classes. By comparing the total sections offered to previous terms, institutions can determine how these decisions became apparent in the data.
- Average number of seats per section
- In addition to reviewing the total number of sections offered, another key metric is the average seats per section. Like the examples listed above, some institutions allowed more students per class in an online class than they would face-to-face, but others split sections into more than one for social distancing. Looking at these numbers in conjunction with the section counts can help tell the story of how an institution reacted to the pandemic.
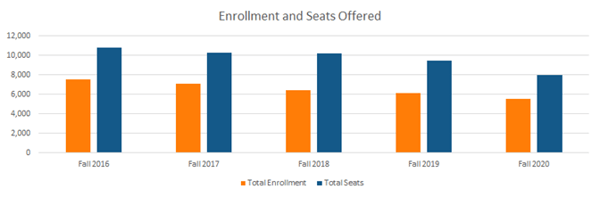
- Total course enrollment
- Finally, the total enrollment across all sections can be another key way to review the data. In some cases, the overall headcount was down for an institution, but the students were taking more courses, so the section enrollment remained steady. In other cases, the overall headcount remained the same, but section enrollment decreased. Attention to these numbers can contextualize the behavior that was expected.
For example, what is the percentage of in-person, online, and hybrid sections in Fall 2019 and Fall 2020? How have your modality definitions changed, and how will that future terms?
Many institutions found it necessary to revise their course offering modalities to better represent all options available to students beyond simple fully in-person and fully online offerings. Likewise, institutions are finding that HyFlex options will be part of the long-term institutional strategy to better meet students’ needs. Before moving forward with the same definitions used for Fall 2020, institutions may want to evaluate the definitions again to account for their long-term post-pandemic strategy.
When will you receive additional data points that could impact your Fall and Spring strategies?
Student success metrics should inform the academic schedule. Consider what leading and lagging metrics are relevant now. Degree Velocity™, momentum year, retention, and graduation metrics will help model what percentage of the returning student population will need to be served. Including pass/fail, pre-requisite, early alert, and other progress data can also inform the scheduling of certain pathway requirements.
What other parameters or guidelines will impact term scheduling?
Several other considerations may impact the course schedule, such as the institution’s financial health, instructional budget, county and state health guidelines, and operations at nearby institutions. Now more than ever, communication and collaboration among institutional stakeholders are essential. A student-aligned course schedule should be foundational in every institution’s student success plan.
Examples
Sample Institution One
- Large 4-year public institution, 2 campuses
- Removed the SAT/ACT test score requirement
- Booming enrollment (headcount projection increase was 20% increase based on admissions/confirmation data)
- Offered 781 additional sections in the current Fall term, a 13% increase year-over-year
- Average section size remained the same despite considering adding additional seats to online sections
- Modality breakdown (Online – 62%, Face-to-Face – 13%, Hybrid – 25%)
- Enrollment in sections increased by 8%
- Enrollment ratio (fill rate or comparison of enrollment versus seats offered) remained steady at 89%
- Success rates for incoming students (especially those that may not have been admitted if the SAT/ACT test score requirement was in place) should be reviewed for Fall and Spring terms
- Nearby institutions are planning to drop the test score requirement for incoming Fall admits
While this institution may assume that current Fall term was an anomaly, looking at the data can help inform how they may want to schedule in the next like term. Enrollment increased for this Fall term, and this institution had to offer 781 additional sections. In planning for the next Fall schedule build, this institution cannot assume they can revert to how courses were offered before the section increases. Instead, they will need to make some key decisions about their plan for modality breakdown.
Sample Institution Two
- Large public 2-year, 8 campuses
- No change in admissions requirements; extended drop without academic penalty
- Enrollment had been declining but starting to level off; early numbers indicated dramatic enrollment decline
- Offered 812 fewer sections in the current Fall term, a 14% decrease year-over-year
- Enrollment in sections remained steady (<1% up)
- Enrollment ratio (comparison of enrollment versus seats offered) improved by 10%
- Move to online allowed for a reduction and consolidation of sections while enrollment stayed static
- Modality breakdown (Online – 85%, Face-to-Face – 3%, Hybrid – 12%)
- Reviewing success rates in fully online asynchronous versus synchronous courses
- Planning to move to much more in-person learning for the next like Fall term
This institution was able to take advantage of section consolidation across offerings that would have been offered on individual campuses in the past. As they return to more in-person learning for future terms, the schedule may align more to pre-pandemic terms. Yet, this institution should consider the ability to use synchronous online learning as a way to prevent very small classes at some of the smaller campuses. If the success rates in synchronous online courses are good, then this could be a way for the institution to be more sustainable in the future by allowing online learning to augment face-to-face inappropriate situations.
Before completely discounting this term’s outlying data, ask the above questions and closely examine the data to further inform the creation of the next schedule. The examples above lend insight into ways the historical term data can be helpful.
About the authors: