
Are you throwing money away on unnecessary utility costs? Regardless of what's going on in the world, everyone's trying to save where they can. Guest blogger and integration partner, Events2HVAC, shares how you can track savings on campus with your room scheduling software and HVAC controls.
_______________________________________________________________________________________________________
Do you know how many of your classrooms are running resources while unoccupied? According to the APPA, a national educational facilities organization, the average college classroom is empty 30-50% of each day. But most college buildings run heat or air conditioning (HVAC) on a daily schedule from morning to night, wasting energy in those empty rooms.
Integrating Ad Astra’s room scheduling solution, Astra Schedule, to HVAC controls eliminates this problem by running HVAC only in rooms scheduled in Astra Schedule. Colleges and universities that have integrated these systems report reducing energy use 20-40% and saving 50 to 75 cents per square foot per year in energy expenses.
Though this Ad Astra integration with Events2HVAC has been around for a few years, there has not been an easy way to visually track savings. Until now.
Runtime analytics tools have been added to Events2HVAC event automation software to calculate and visually display the total hours of “runtime savings” achieved by returning HVAC equipment to unoccupied settings between each class or event. Runtime savings are simply the hours that HVAC is set back to unoccupied settings, rather than running at occupied settings that use more energy. Energy managers can use runtime savings data in coordination with energy-use rates for their specific HVAC equipment to calculate energy savings. This will simplify the process of calculating energy savings and allow energy managers to quickly view graphical savings results.
When viewing runtime-savings results in Events2HVAC, users can group the data in different ways. For example, users can look at results for an entire campus, an individual building, or a specific type of equipment. For each group, users can view the results by week, month, or year.
By default, runtime-savings results are displayed by year and month, as shown in the example below:
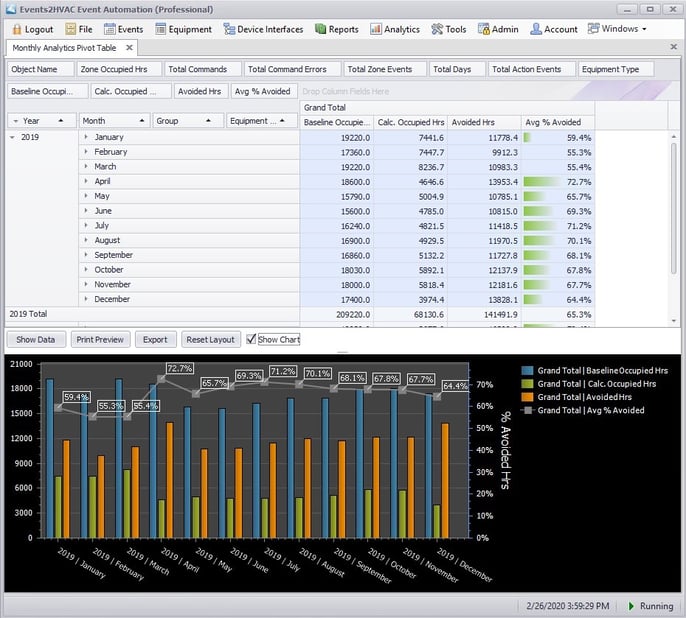
In the top half of the screenshot above, you can see the cumulative data for each month of 2019 and the total for the year. Data provided in the highlighted blue columns are explained from left to right below:
- The Baseline Occupied Hours are the cumulative, monthly building hours from morning to night that HVAC would normally be running without Events2HVAC (i.e., 7 a.m. – 8 p.m. daily, Monday-Friday, totaled for each month).
- The Calculated Occupancy Hours are the cumulative, monthly hours HVAC equipment was running at occupied settings, driven by Ad Astra schedules coming through Events2HVAC.
- The Avoided Hours are the cumulative, monthly hours of HVAC runtime saved – the difference between the Baseline Occupied Hours and the Calculated Occupancy Hours.
- The Average % Avoided is the Avoided Hours expressed as a percentage of the Baseline Occupied Hours to show the percent reduction in HVAC runtime for each month. The total for the year is shown at the bottom. HVAC runtime at occupied settings was reduced by 65.3% in 2019 in this example.
Just above the data area, tabs enable users to filter the data to focus on a specific Group, which might be a building or satellite campus; or to focus on a specific type of Equipment, such as all air handlers connected to the system. This flexibility will be very helpful to energy managers who use these tools to calculate energy savings.
The bottom half of the screenshot above shows a graphical version of the tabulated data presented in the top half.
- The blue bars represent the Baseline Occupied Hours – previous daily building hours.
- The green bars represent the Calculated Occupancy Hours – based on Ad Astra schedules.
- The orange bars represent the Avoided Hours – runtime savings.
- The Average % Avoided for each month is written in white at the top of the graph.
It is our hope that these tools will help Astra Schedule and Events2HVAC users accomplish many goals, including:
- Tracking progress toward meeting campus sustainability goals.
- Providing data to help buildings become LEED certified.
- Determining which buildings will benefit the most from this integration in terms of energy savings.
Interested in more information? Please contact Streamside Solutions at sales@streamsidesolutions.com.
About the Author:
Streamside Solutions has helped universities and community colleges reduce energy use and operating expenses for more than 10 years with Events2HVAC.
This blog supports financial health in the Managing the Academic Enterprise framework. Click here to learn more.