
Inside Ad Astra’s Managing the Academic Enterprise course, we ask academic leaders to reflect on their institution’s definition of student success, how it is measured, communicated, and shared across campus stakeholders. The first week of the course is grounded in this activity because an institution’s definition of student success is central to its mission. This activity and the resulting conversation among participants are often one of the most important takeaways reported by participants.
As you might imagine, how institutions define student success is driven by how student success is measured. Many institutions measure student success using primarily lagging indicators, such as retention and graduation rates. While helpful for determining whether a goal has been met, the lagging indicators do not necessarily allow for analysis and implementation of specific interventions with a current cohort of students. Because lagging metrics are required for IPEDS and other institutional reporting needs, they are convenient, widely adopted, and easily understood by institutional stakeholders.
Leading indicators allow an institution to analyze progress of a specific cohort of students toward a goal. While leading indicators are not typically required metrics for institutional reporting needs, academic leaders recognize the value of leading indicators to inform early student success interventions. For example, Degree Velocity® measures the productive credit hour completion rate for a student or cohort of students. It is a leading metric that allows institutions to understand students’ progress toward degree completion, rather than waiting to understand their time to completion after four or six years.
Comprehensive Degree Velocity® analyses provide insights into the anticipated graduation rate of a cohort if students continue at their current rate of progress. It is an enhanced lens into progress because it goes beyond gross credit hour accumulation to assess which of those credits are productively meeting pathway requirements. Using the current progress rate or Degree Velocity®, progress in future semesters and time to completion can be modeled.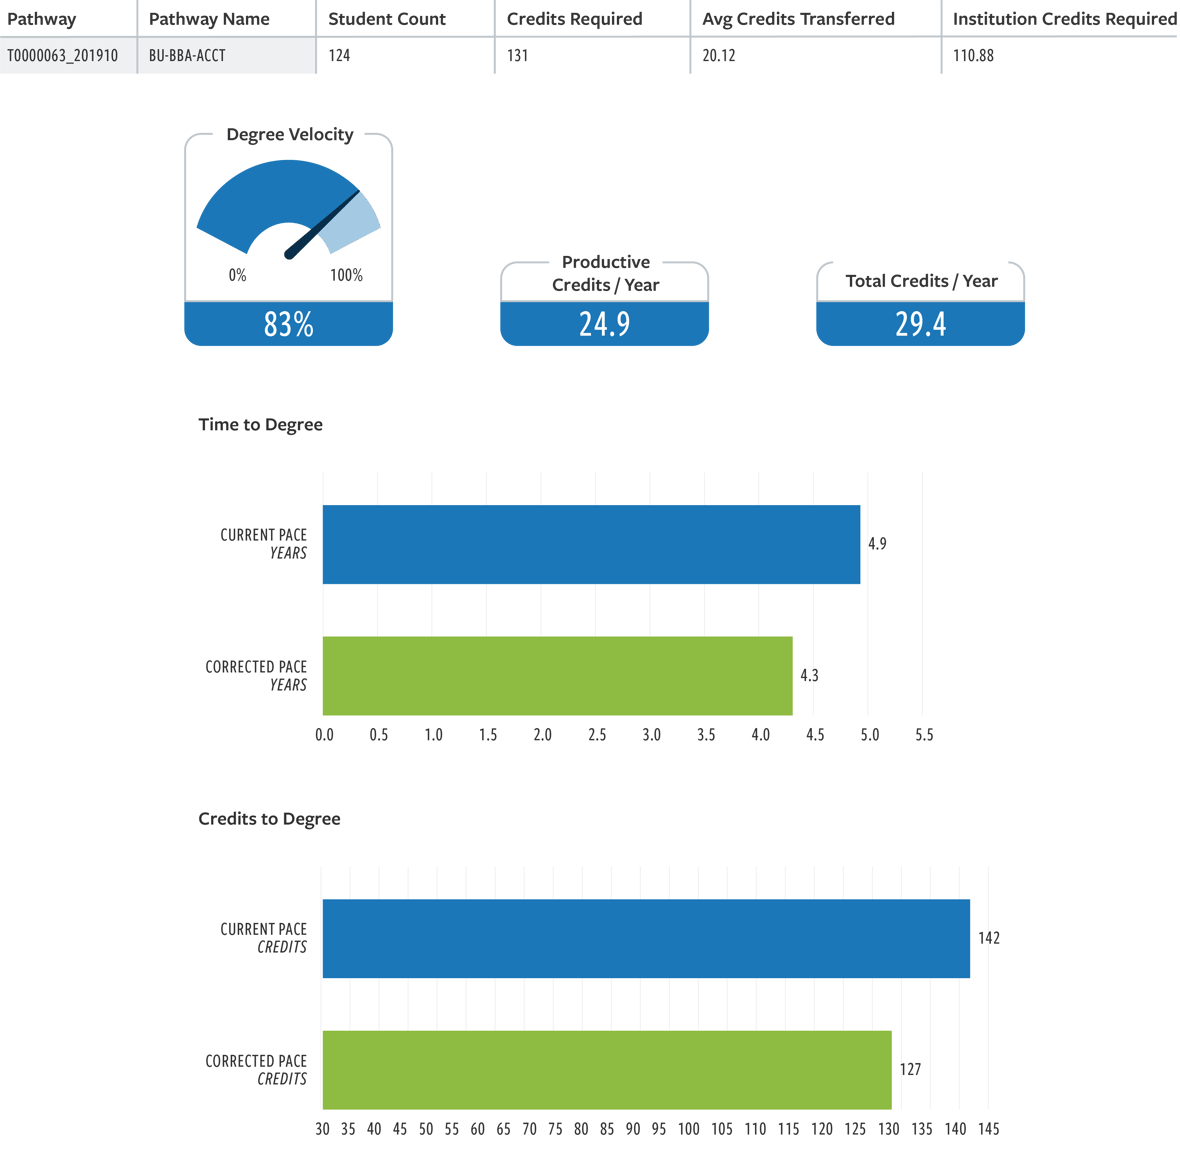
In the illustration above, the students in this accounting pathway example are, on average, completing 29.4 credits per year. However, only 24.9 credits (on average) are productive or count toward their degree requirements. If the goal is to have students take 30 productive credits per year, then their average Degree Velocity® in this scenario is only 83% or 24.9/30. The blue bar illustrates that at the current pace of 83% Degree Velocity® each term, it will take students 4.9 years to complete their degree. The green bar illustrates that at a corrected pace of 100% Degree Velocity®, it would take students 4.3 years (on average) to reach degree completion. A deeper analysis would reveal insights about where students are veering off their pathway and provide actionable insights for leaders to remove barriers.
Leading and lagging indicators can work well together to help leaders effectively manage the academic enterprise. Lagging indicators tend to measure historical performance, while leading indicators measure ongoing progress toward a goal. For example, a person with the goal of losing 20 lbs. might only periodically measure their weight. Weight is a lagging indicator. It measures the goal – weight loss but does little to inform progress along the way. Leading indicators for this type of goal might include calories consumed and calories burned. They work together to keep you on track, inform you of where to adjust, and measure the overall goal. Similarly, if graduation rate measures the institution’s completion goal, Degree Velocity® informs real-time progress and lets the institution know whether they are on track to attain their graduation rate goal and what actions to take to positively impact it.
Without leading indicators, institutions are unable to closely monitor effectiveness and refine early student success interventions. Further, institutions that disaggregate leading indicators by student subgroups will be able to understand if equity gaps are present and be strategic about intervention strategies. Considering robust leading and lagging indicators allows leaders to develop, implement, and monitor progress toward equitable institutional outcomes and best support student success in ways that support their institutional mission and definition of student success.
Find more resources around Degree Velocity® in our Academic Planning Resource Center.